Software Wizards – How Programmers Visualise Complex Data for Scientific Users
Loading data, a few mouse clicks – the 3D animation is finished! Among laymen this may appear to be witchcraft, but computer scientists Tobias Brix and Aaron Scherzinger know that programming all the intricate functions of a software is hard work. They are working at the Department of Mathematics and Computer Sciences and developing a program that allows different users, from all different faculties, to morph complex datasets into vivid 3D-graphics.
One of these users is Philipp Bovenkamp. He is working in the University of Münster’s Research Group for Experimental Magnetic Resonance. Using measured data from magnetic resonance tomography, he analyses blood flow in the heart’s two main arteries. But with his old software, he could not really get a picture of the speed and direction of the blood particles. Thus, he gave his datasets to the two computer scientists. The software wizards pooled the data into 3D images.
Photos


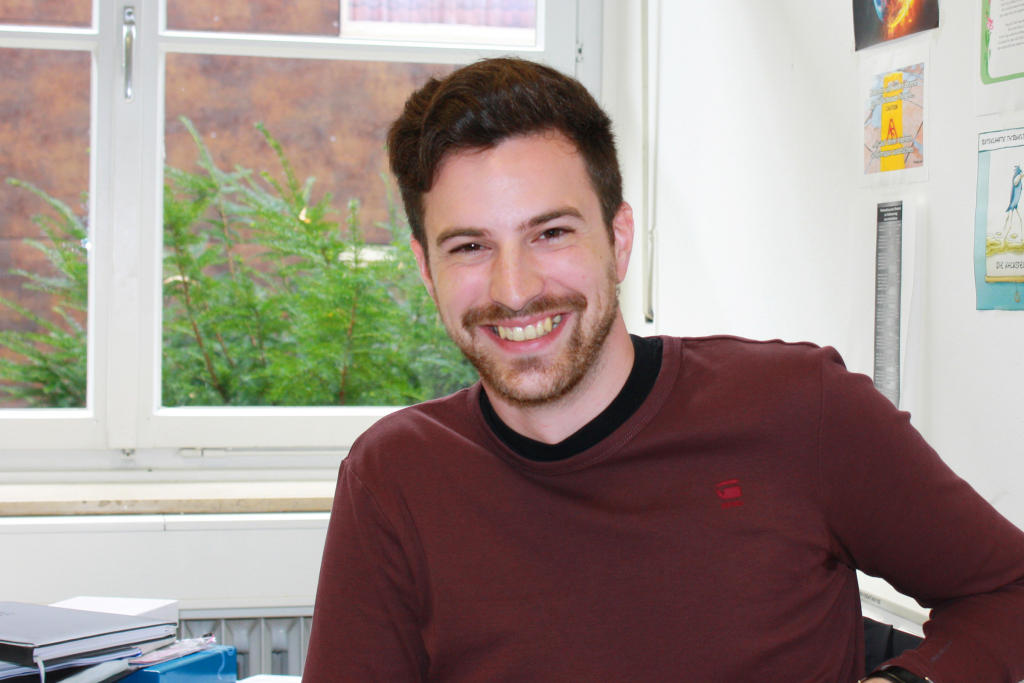
Medical physicist Philipp Bovenkamp analyses measured data from magnetic resonance tomography. He wants to find out exactly how fast the blood moves and if there are irregularities in the blood flow.© CiM - Frank Schlegel 
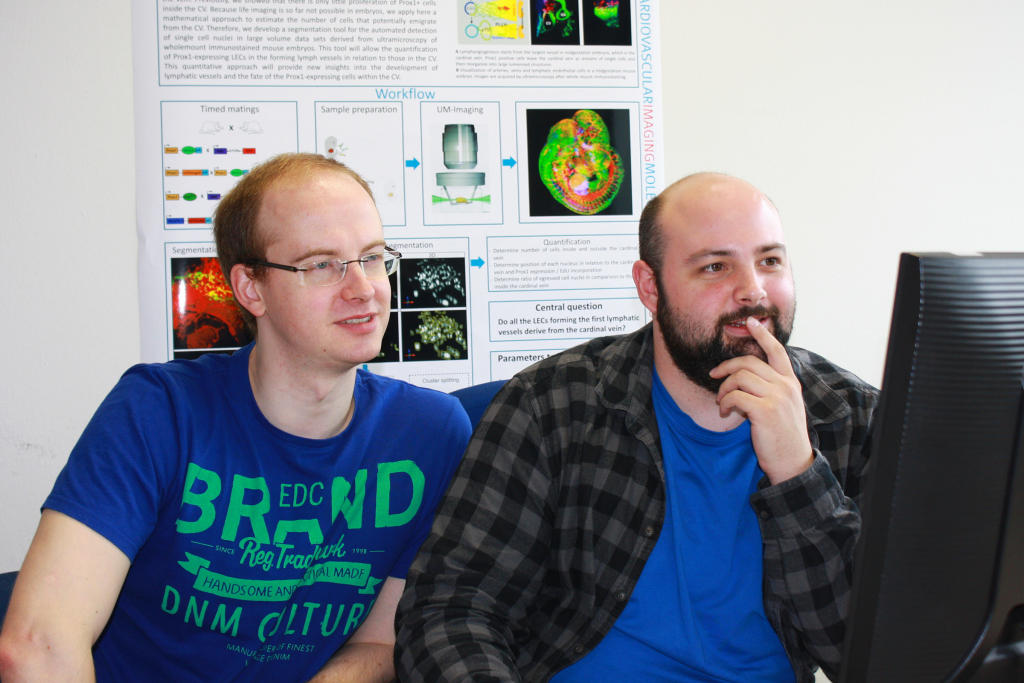
Computer scientists Tobias Brix and Aaron Scherzinger extended the software Voreen for this special approach. Scherzinger is programming for the operating system Linux, Brix for Windows.© CiM - Frank Schlegel 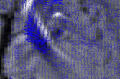
Before working together with the two computer scientists, Philipp Bovenkamp used the software Matlab. Here each blue arrow shows the local movement of a blood particle; the length of each arrow represents its speed.© AG Experimentelle Magnetische Kernresonanz - Philipp Bovenkamp 
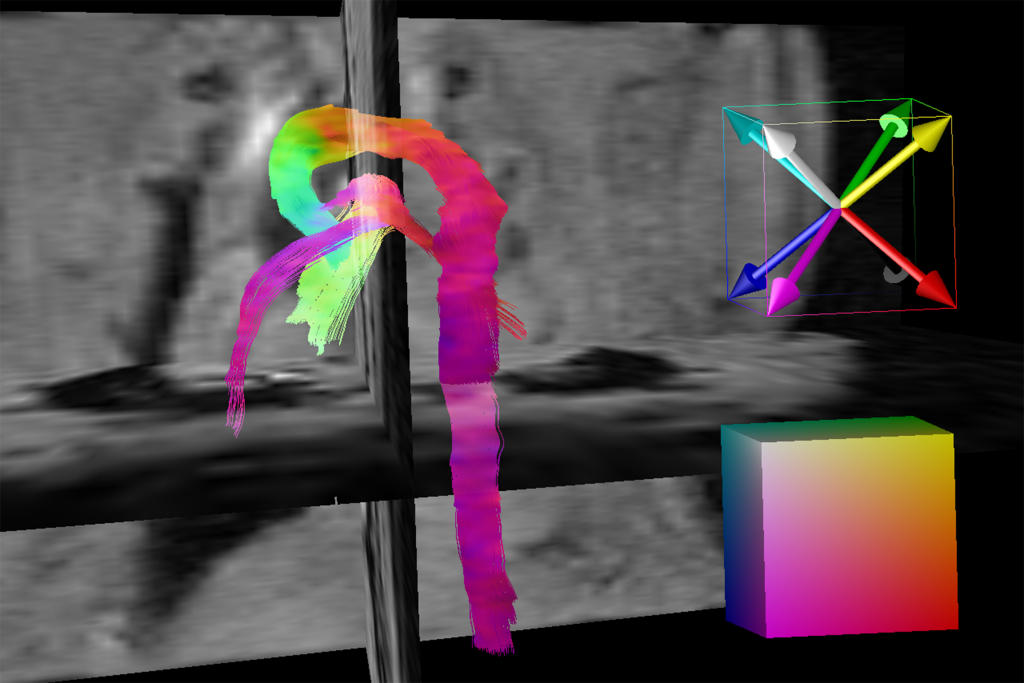
In Voreen, the image of the heart is three-dimensional and the blood flow appears as a set of streamlines. One of the program’s many functions: Whenever blood particles change direction, so does the colour of the streamlines.© AG Experimentelle Magnetische Kernresonanz - Philipp Bovenkamp 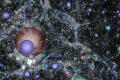
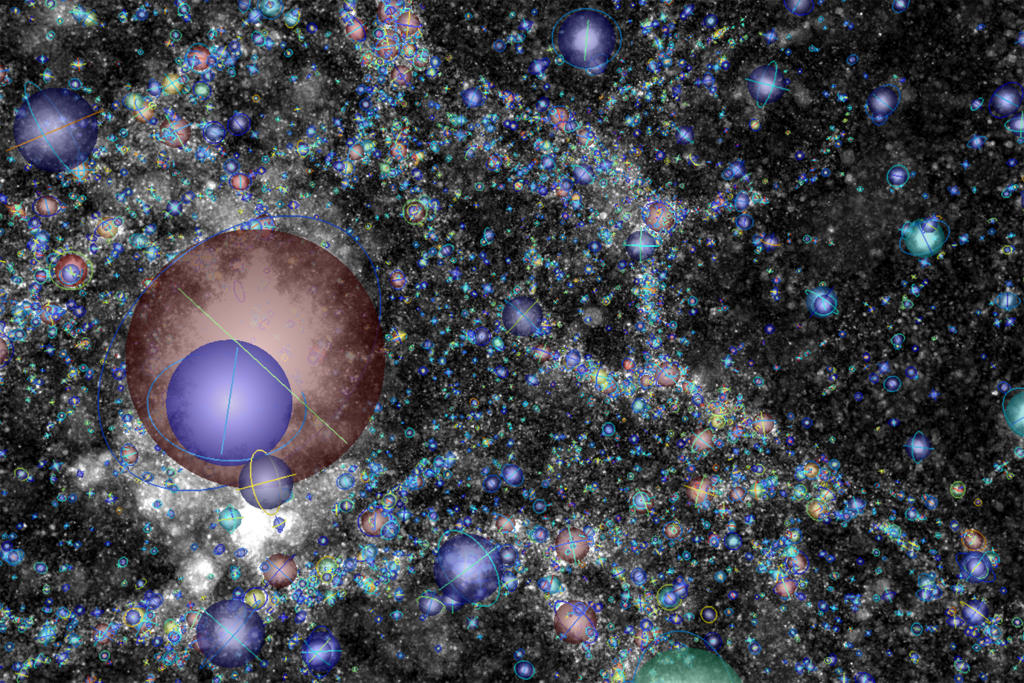
Tobias Brix and Aaron Scherzinger can visualise more than just bodily features. Together with four students, they have visualised a giant simulation of dark matter using data made available by Stanford University.© Tobias Brix, Aaron Scherzinger